How To Create A Speed Display For Your Longboard
How to create a speed display for your longboard using a Raspberry Pi and Python
Introduction
During one of the first longboard trips this year, I had the idea that it would be nice to display the approximate speed at which I'm currently riding. However, I did not simply want to show the numeric value but translate it into a corresponding color spectrum. In this article, you will learn how to approach this using a Raspberry Pi and Python.
Note: You can find this article's code snippets on GitHub.
Assembling the Necessary Hardware
Here is a list of components needed to build your own speed display:
- Raspberry Pi
- External Power Supply
- Raspberry Pi Camera Module v2
- Pi+Camera Case
- 8x8 Dot Matrix (including Jumper cable)
Given that I had an unused Raspberry Pi at home, that one will serve as the main controller. To protect it during a ride, you should put it into a case. Of course, we also need an external battery as a mobile power supply.
Note: When choosing a power bank make sure that it meets the power supply requirements [1] of your Raspberry Pi. Moreover, it should be big enough to last a couple of hours so that you don't have to charge it after every ride.
Furthermore, we need some kind of device which we can use to display the speed. Either this could be a full RGB-lightbulb or a simple dot matrix. Owing to the protection box I chose, most of the available lightbulbs fall through the cracks. This is due to the fact that even though my Pi's case is transparent so that you could see the light, it does not provide sufficient space to plug the lightbulb directly onto the GPIO ports. Using a dot matrix instead, I get the wiring out of the box and will be more flexible concerning the display positioning. However, dot matrices are uni-color. Thus, we have to find another way of depicting the speed visually than through a color spectrum. But let's do that later.
Last but not least, we need something to detect the longboard's speed. Creative minds certainly find a bunch of options. I decided to use the camera module. Thanks to a little extension, it is easy to attach on top of the Pi's case.
Connecting the Components
From a technical point of view, wiring the hardware modules is fairly easy. The picture below shows you the final connection setup.
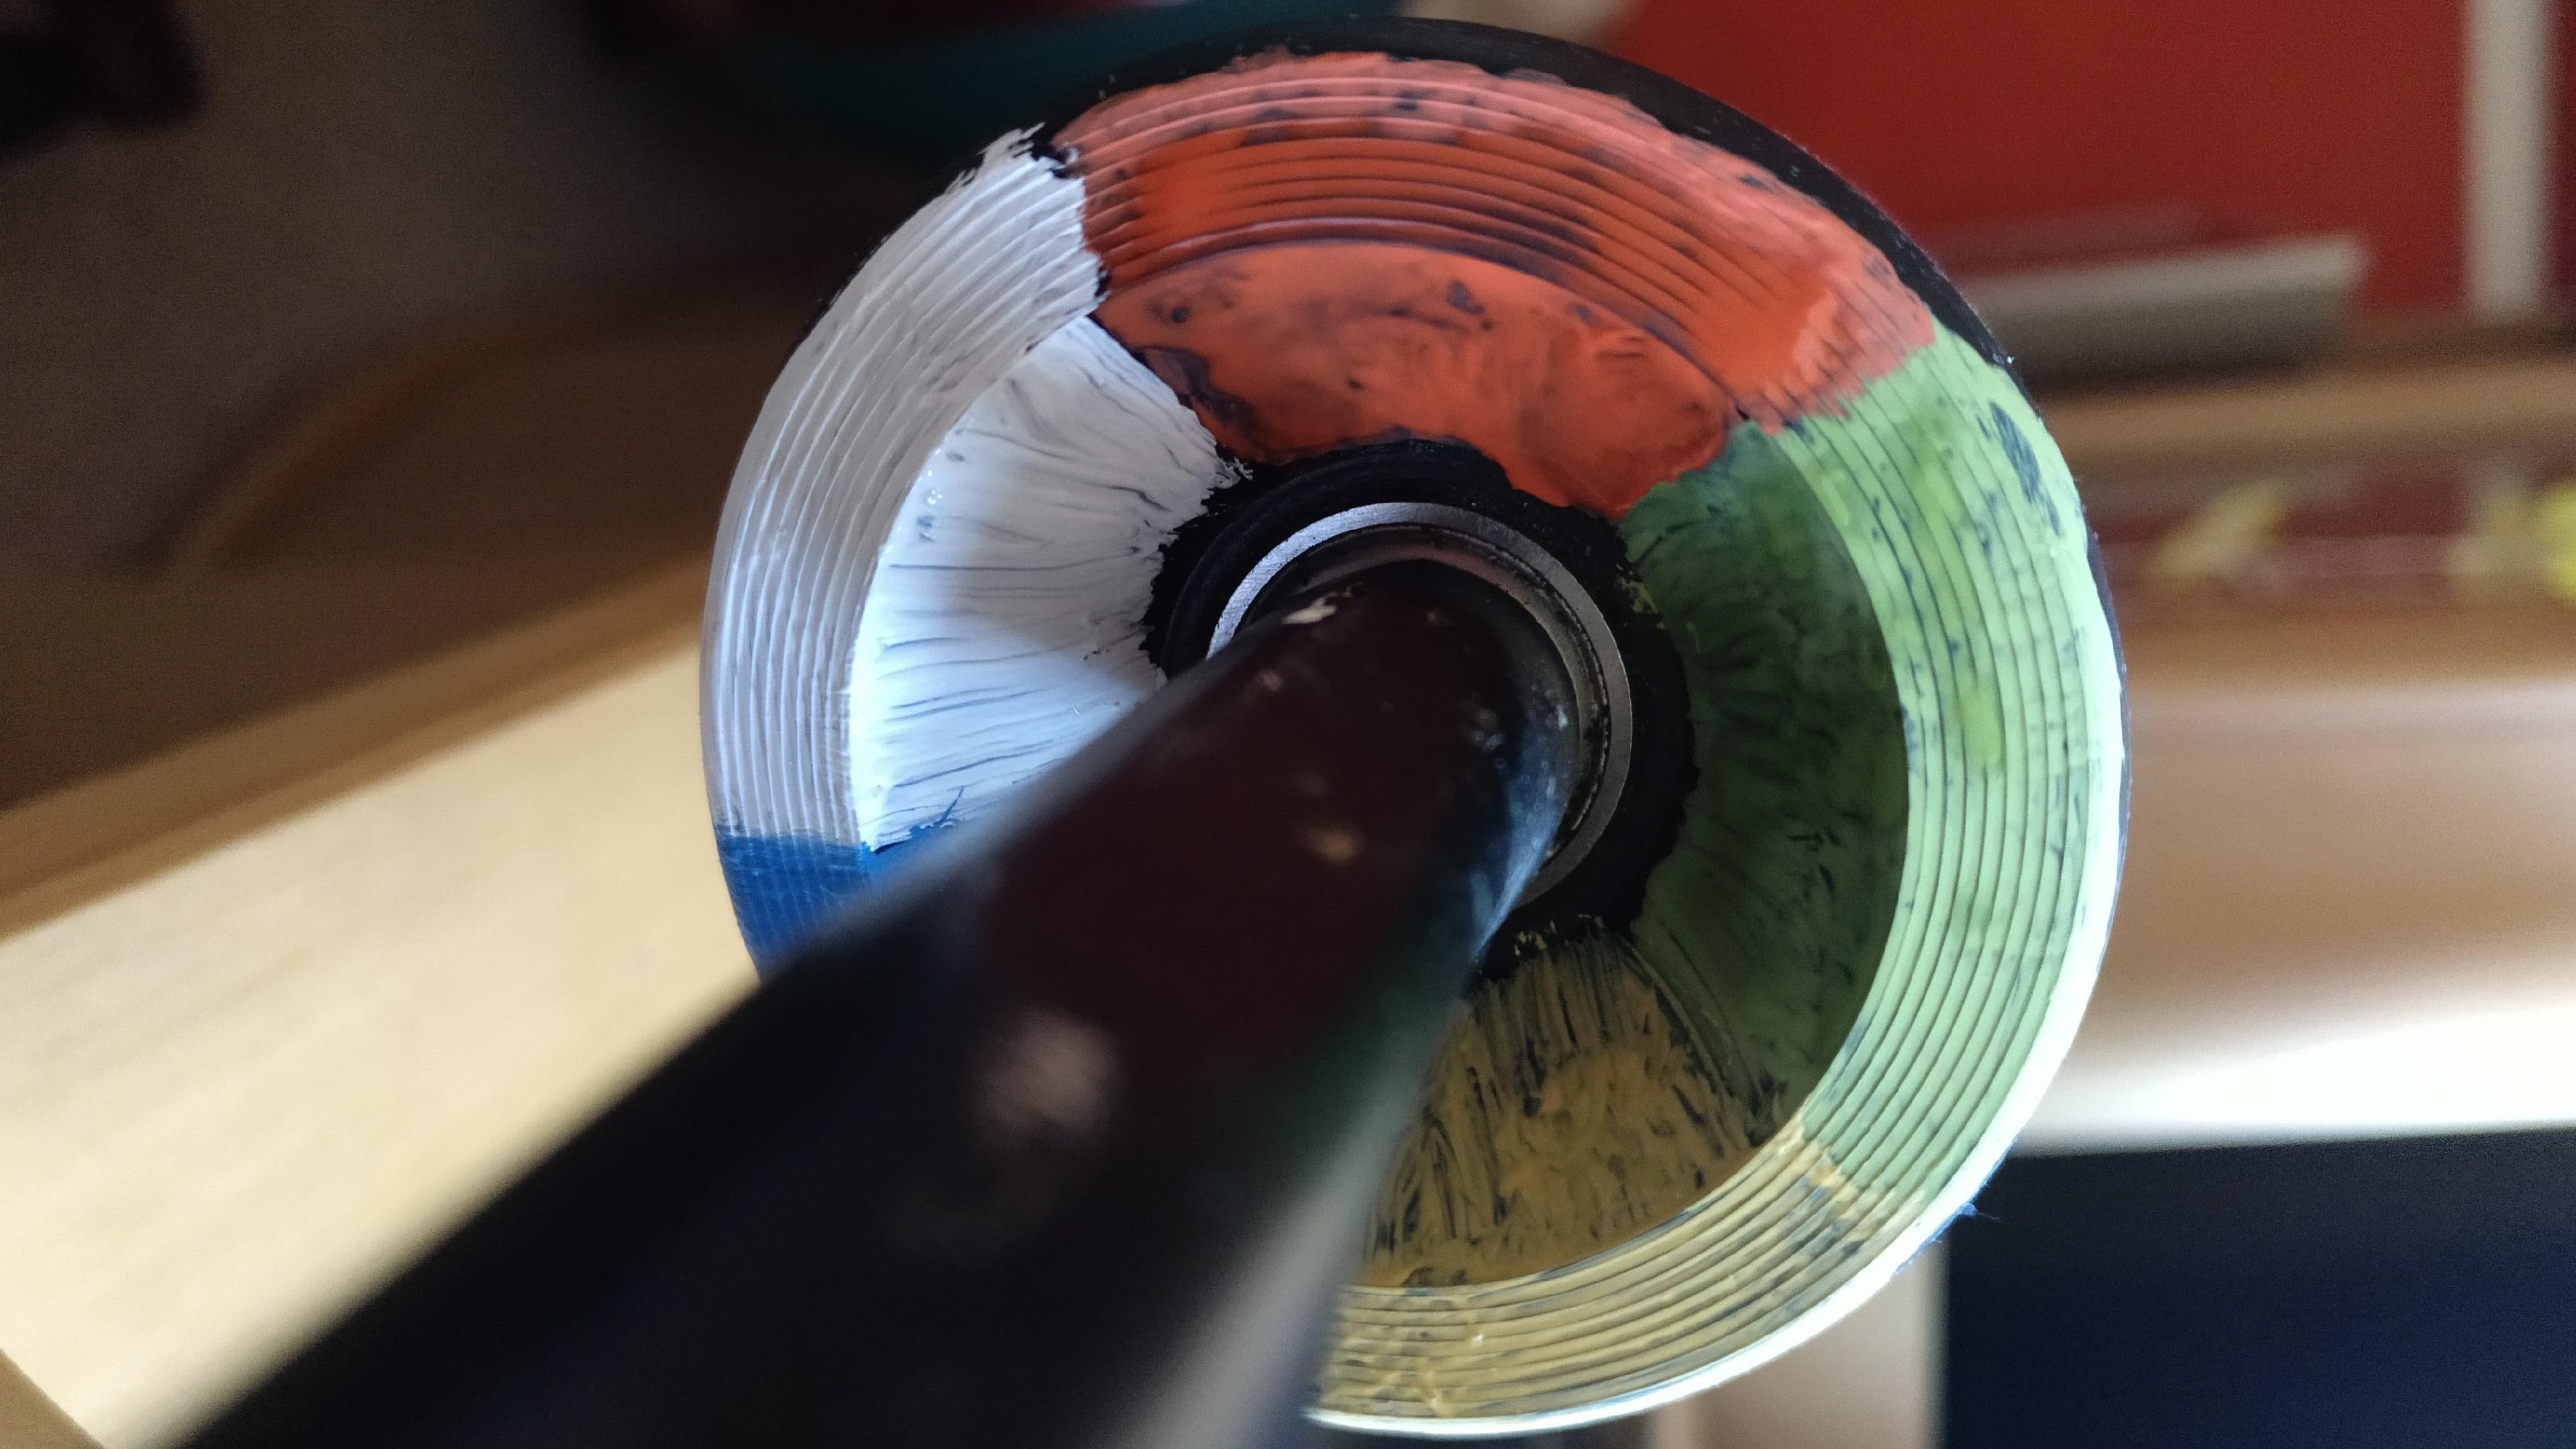
One of the longboard's wheels has to be painted in five equally sized slices of different colors. I preferred one of the front wheels because it will make it easier to look at the speed display while riding.
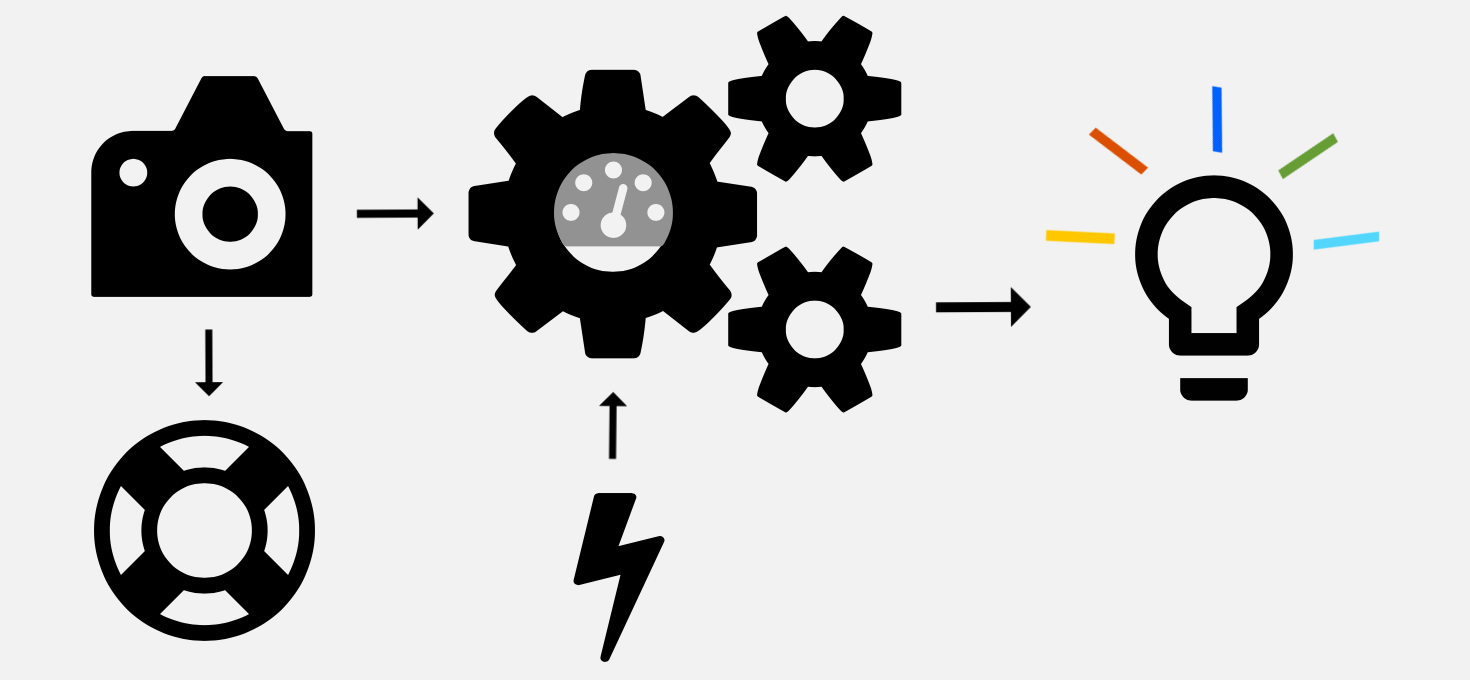
From a logical point of view, the components will interact as follows: The Pi camera ceaselessly takes pictures of the moving wheel. Those pictures will be processed by the Pi, which calculates an approximate speed. That one will be translated into an image, that can be displayed by the dot matrix. All components obtain their energy either directly or indirectly from the external power supply. Below, you can find out how each of these steps works in detail.
Capturing the Moving Wheel
The Pi camera can be controlled with the PiCamera library. It contains a large number of capturing, image editing and processing methods.
We use the capture_continuous() function to receive the sensor's data without respite.
"This method returns an infinite iterator of images captured continuously from the camera." [2]
Moreover, we set the use_video_port parameter to True to get a more rapid capture of images.
In doing so, a bit of quality will be forfeited but in our case this is bearable.
As a result, we can theoretically record the wheel's turn more or less every couple of milliseconds.
To give you a reference value: the normal capture() method takes about 0.4s, that is 400ms, per picture.
The value returned from capture_continuous() is converted into an RGBArray.
The latter is a NumPy array of shape (row, column, pixel_value).
This means we can directly access the RGB-values of a 10x10 square of pixels.
# main.py

import numpy

from picamera import PiCamera, array

from calc_speed import calculate_speed
from color_matrix import initialize, light_up
from get_color import define_color, extract_value


_SLICE_LENGTH = 3.9
_CONV_FAC = 0.036
_ITERATIONS = 50

with PiCamera() as camera:
    with array.PiRGBArray(camera) as output:
        start = time()
        for frame in camera.capture_continuous(output, format="bgr", use_video_port=True):
            image = frame.array
            # adjust this depending on your camera's orientation
            y_pos = image.shape[0] // 4
            x_pos = image.shape[1] // 2
            extract = image[y_pos:y_pos+10, x_pos:x_pos+10]
Thereafter, the pixels' average value will be used to identify the wheel's current position. Keep reading to find out how this translation can be implemented!
# main.py inside the for-loop

avg_color_row = numpy.average(extract, axis=0)
avg_color = numpy.average(avg_color_row, axis=0)
hue = extract_value(avg_color)
Important: Don't forget to call
output.truncate(0)at the end of the for-loop so that your camera can continue to write data to the RGBArray.
Extracting Position Data From the Image
In order to calculate the current speed at which we're riding, we will first convert the RGB average value into HSV using the colorsys module from the standard library.
Note: The HSV color system describes a color by its hue, saturation and value (respectively brightness). This makes it fairly simple to extract a pixel's color based on one value, namely the hue. This is because saturation and value only impact the color's intensity.
Then, we can use the hue value to find out which slice of the wheel was just moving past the camera's lens. To this end, the hue color spectrum can quite simply be divided into five main colors:
| color | hue range |
|---|---|
| red | 0-35, 330-360 |
| yellow | 36-65 |
| green | 66-175 |
| blue | 176-265 |
| (purple) | (265-330) |
On account of my poorly equipped color palette, we'll distinguish between red, yellow, green, blue and white instead of purple. Even though the latter cannot be deduced from the hue value, either a very low saturation or a very high brightness value indicates that the white slice was captured. So, the conversion of the RGB value to HSV works as follows:
# get_color.py

import colorsys

def extract_value(pic):
    hsv = colorsys.rgb_to_hsv(pic[0] / 255, pic[1] / 255, pic[2] / 255)
    if hsv[1] <= 0.1 and hsv[2] >= 0.8:
        hue = "white"
    else:
        hue = int(hsv[0] * 360)
    return hue
Now, we need to map the 100 pixels' average hue value to one of the colored slices and return the corresponding slice number.
# get_color.py

def define_color(hue):
    if type(hue) == str:
        # white
        return 2
    else:
        if (hue <= 35 and hue >= 0) or (hue > 330 and hue <= 360):
            # red
            return 3
        elif hue > 35 and hue <= 65:
            # yellow
            return 5
        elif hue > 65 and hue <= 175:
            # green
            return 4
        elif hue > 175 and hue <= 265:
            # blue
            return 1
        else:
            return 0
Then, that slice number is compared to the last one to find out how many slices the wheel moved forward.
# calc_speed.py

_SLICES_NUM = 5


def calculate_speed(old, new):
    if new >= old:
        return new - old
    else:
        return new + (_SLICES_NUM - old)
Each of the slice ids will be stored together with the time it took to capture the image and do the above calculations:
# main.py inside the for-loop

old_color = new_color
new_color = define_color(hue)
slices = calculate_speed(old_color, new_color)
last_speeds.append((slices, time() - start))
Calculating the Speed
Given that each iteration takes about 60 milliseconds in total, we will calculate the current speed always after 50 captures. On average, this occurs after about 3 seconds. The slices rolled by during the last 50 iterations are added up, multiplied by 3.9cm (the length of each slice) and divided by the execution time. This gives us the speed in cm/s. The conversion factor from centimeters per second to kilometers per hour is 0.036.
# main.py still inside the for-loop

if counter != _ITERATIONS:
    continue

distance = _SLICE_LENGTH * sum(s for s, _ in last_speeds)
km_per_h = distance / (time() - start) * _CONV_FAC
Displaying the Speed
So, the matrix is almost about to light up! However, before this can happen we need to do two more things:
- Setup the dot matrix: Indeed, this happens by calling
initialize()even before the camera is initialized. - Convert the speed into something that can be displayed with 64 dots.
Any communication with the dot matrix happens with the help of the Luma.LED_Matrix library. It has some very handy methods to display text and pictures so that we can concentrate on the speed visualization.
# color_matrix.py

from PIL import Image

from luma.core.interface.serial import noop, spi
from luma.led_matrix.device import max7219


_MX_SIZE = 8


def initialize():
    serial = spi(port=0, device=0, gpio=noop())
    device = max7219(serial)
    return device


def light_up(count):

    matrix = Image.new('1', (_MX_SIZE, _MX_SIZE))

    # augment number for better visualization
    points = 64 if count > 32 else count * 2
    full_rows = points // _MX_SIZE
    remainder = int(points % _MX_SIZE)

    for row in range(full_rows):
        for col in range(_MX_SIZE):
            matrix.putpixel((col, row), 1)

    for point in range(remainder):
        matrix.putpixel((point, full_rows), 1)

    return matrix
So, as you can see in light_up(), we use an 8x8 PIL image to prepare the image.
The km/h are multiplied by 2 to make them better identifiable on the dot matrix.
Then, we calculate how many full rows have to be lighted and how many single dots remain.
Note: Depending on your pace you probably want to adjust the conversion of
counttopoints.
In main.py, the last steps are chained as follows:
# main.py at the end of the for-loop

image = light_up(int(km_per_h))
device.display(image)
Make Your Setup Roadworthy
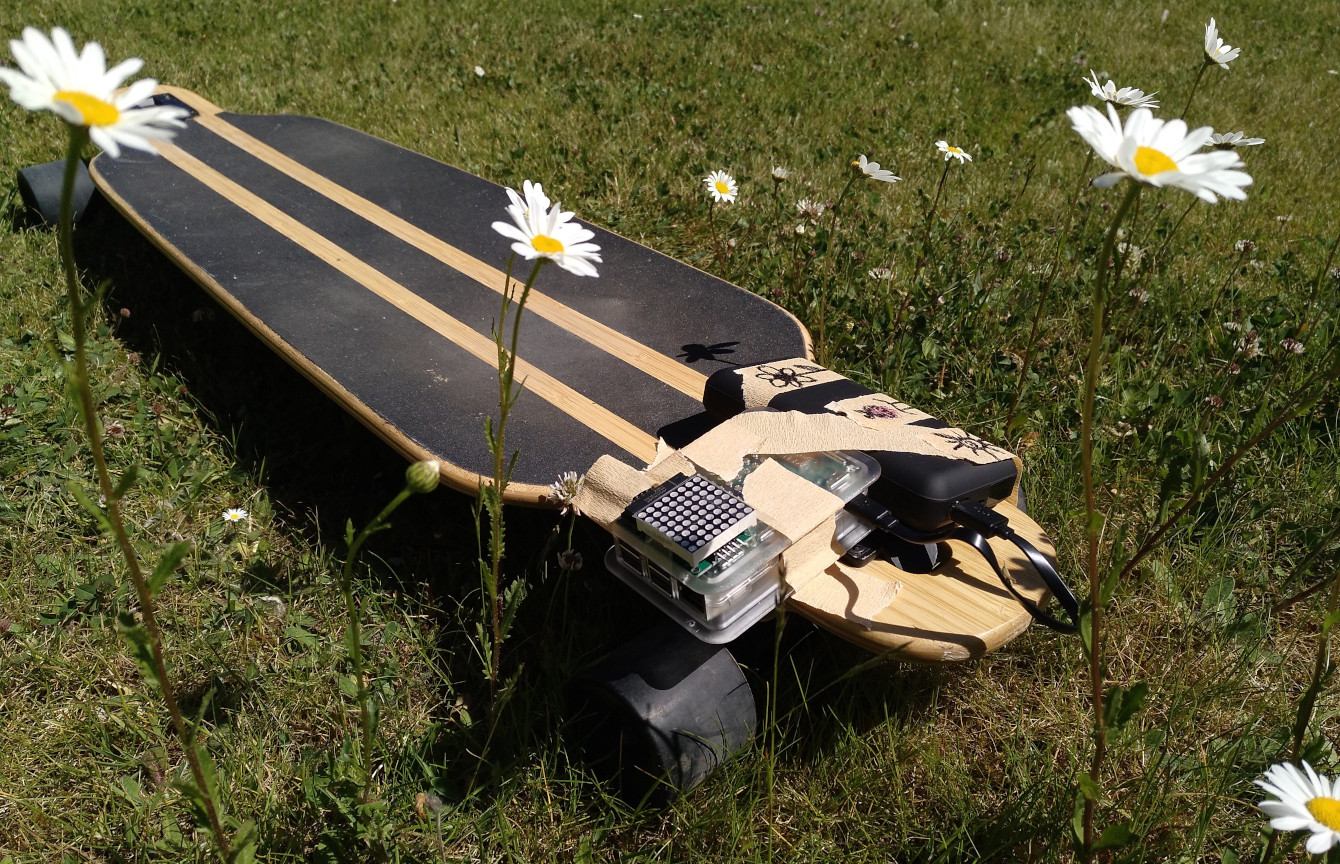
It is time to think about how to adjust all the components on the board and how to start our little program. Concerning the former, you will be out on a limb because every board is different. This holds especially for the space between wheel and board so that you may have to be a little bit creative about how to fix the camera. However, here is an impression of my beautiful assembly:
As concerns the program fetch, a resilient solution needs something more sophisticated than a simple python3 main.py.
For one thing, I don't want to pull my laptop out, connect it to the Pi and start the program manually every time.
Furthermore, disconnecting from the Pi once the program has been started will break its execution.
Thus, we need to find a solution to run the program automatically and ideally at startup.
Doing so, you can simply start your Pi in the middle of nowhere and will have a running speed display after a few seconds.
There are several options on how to start a program during the boot process.
For instance, you could use systemd, crontab, init.d or autostart.
However, in our case, each of them has some kind of disadvantage which is why I recommend you use rc.local instead.
It is executed at the end of the boot process.
Simply add sudo python3 /home/pi/longboard_speed/main.py & after any existing entries but before exit 0.
If you restart your Pi now, the program should run by itself.
Important: Don't forget the ampersand! Otherwise, the boot process cannot be completed because our program is meant to run infinitely. Without outsourcing it to another process, booting would be blocked.
Wrap-Up
Great work! With nothing more than a handful of hardware components and a few lines of code, you created your own speed display. Hit the road and enjoy your trip o\<]: !
Impulses to Carry On
As soon as you're back home, consider improving the project by ...
- using enums for the wheel's slice ids in
get_colors.py. This allows you to kill two birds with one stone because simultaneously, you get the chance to apply what you've learned about enums from Florian two weeks ago. - implementing a more sophisticated way to get the main recorded slice color.
For example, you could try to use Pillow's
getcolors()function or even OpenCV'skmeans()function. - using an RGB-LED instead of the dot matrix.